The Current View
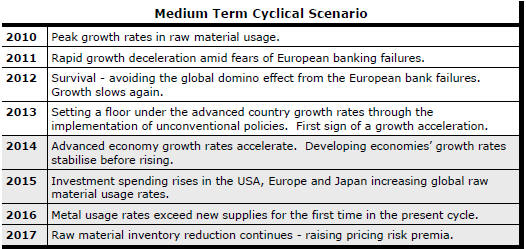
Growth in demand for raw materials peaked in late 2010. Since then, supply growth has continued to outstrip demand leading to inventory rebuilding or spare production capacity. With the risk of shortages greatly reduced, prices have lost their risk premia and are tending toward marginal production costs to rebalance markets.
To move to the next phase of the cycle, an acceleration in global output growth will be required to boost raw material demand by enough to stabilise metal inventories or utilise excess capacity.
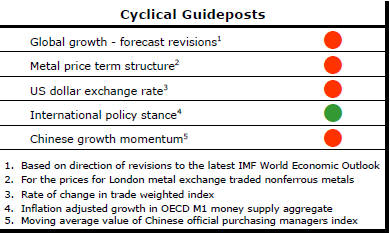
The PortfolioDirect cyclical
guideposts suggest that the best possible macroeconomic circumstances for
the resources sector will involve a sequence of upward revisions to
global growth forecasts, the term structure of metal prices once again
reflecting rising near term shortages, a weakening US dollar, strong money
supply growth rates and positive Chinese growth momentum. Only one of
the five guideposts is "set to green" suggesting the sector remains confined
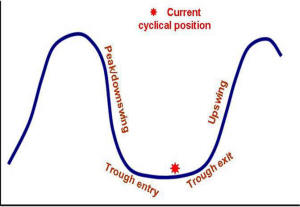
to the bottom of the cycle .
Has Anything Changed?
Throughout 2014, PortfolioDirect had been characterising the cyclical position as ’Trough Entry’ with some expectation that by the end of 2014 an exit would be evident. Until very late in the year, the evidence supported that possibility before conditions took several backward steps.
The absence of a growth acceleration among the major economic regions is contributing to the flagging momentum. A stronger US dollar is also imparting a downward bias to US dollar denominated prices presently. This is looking less like a temporary move than a multiyear change of direction.
The flow of metal market statistics is pointing to a marked slowing in usage growth in 2015.
Euro Area Lending Remains Weak
Euro area lending to nonfinancial corporations contracted for the third
consecutive month in May. Loans outstanding were 0.5% lower than at the end
of May 2014, according to data from the European Central Bank. Loans at the
end of May were 11.9% lower than the peak level recorded in January 2009.
Some progress toward an expansion of lending has occurred. The low point in the lending cycle appears to have been in December 2014. Loans at the end of May were 0.7% higher than at the cycle trough.
Lending to households - primarily for housing - has proven marginally more resilient insofar as the amount outstanding at the end of May was 1.0% higher than in May 2014. Nonetheless, the overall picture remains indicative of still subdued rates of activity with business, in particular, still some way from being able to support an acceleration in output growth.
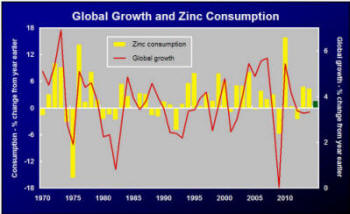
Are Zinc Market Optimists Right?
Zinc market optimists are saying price prospects for zinc, of all the main
metals with equity market connections, are the rosiest. They could be
right. The differences in market balances across the different market
segments are not so great that one can be dogmatic about the relative
outcomes one way or another.
 Nonetheless,
the zinc bulls must contend with three potentially damaging recent hits to
their position.
Nonetheless,
the zinc bulls must contend with three potentially damaging recent hits to
their position.
The latest International Lead Zinc Study Group data have shown a 209,000 tonne reduction in the February estimate for metal usage in 2014 leading to a stronger growth requirement in 2015 to sustain the inventory level thought previously anticipated in support of stronger price outcomes.
Secondly, usage growth is losing momentum. The ILZSG data for the first four months of 2015 point to usage growth of 1.8% this year compared to growth of 4-5% in each of the preceding two years. Currently slower growth places a heavier burden on growth in future years to achieve the cut back in inventories necessary to push prices higher.
Thirdly, forecasters are also forgetting the role of the exchange rate. That throws cold water on zinc prices rising while the US dollar is also rising.
Tin Prices to Outpace Zinc Based on History
Over the long haul, there is no discernible tendency for one metal out of
the six main daily traded base metals - aluminium, copper, lead, nickel, tin
and zinc - to do better than any other. An analysis of relative metal price
returns suggests that zinc prices may perform worse than average as tin
catches up after lagging behind.
Over the last 35 years, nickel has had the worst annual performance ranking of 3.9 out of six (when the worst performing metal is ranked six). Tin (3.7), aluminium (3.6), zinc (3.4) and copper and lead (both 3.3) follow in order of improving performance but the difference between the best performing and worst is not material.
Over the last five years including 2015, on the other hand, zinc has had an unusually strong performance ranking with a score of 2.2. Within the context of an overall cyclical decline in prices, zinc prices have fared the best. If history is any guide, the superior performance of zinc will not be sustained.
A shorter term analysis of performance shows a similar picture. Since the beginning of 2013, monthly movements in zinc prices have exceeded the average movement for the six metals 63% of the time. Over the entire 35 years prior to 2015, zinc prices were ahead of the average 52% of the time and outcomes for all metals fell in the range between 45% and 52%.
The strong historical tendency for price performance to converge suggests that tin prices should do best over the next year or two while zinc returns should be the lowest of the six.
These inferences ignore changes in market balances that might be expected to normally affect prices although the line of causation is not one way. Recent price movements will have already started to affect future market balances. Investible funds and industry planning will have commenced favouring the industry sectors with the most bullish forecasts.
Investment flows biased in favour of zinc capacity and away from tin are already evident, tending to raise the chance of tin prices eventually performing better than zinc prices due to underinvestment to realign the performance relationships.