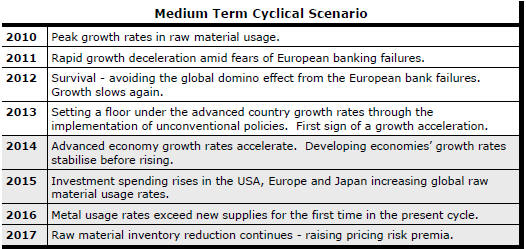
The Current View
Growth in demand for raw materials peaked in late 2010. Since then, supply growth has continued to outstrip demand leading to inventory rebuilding or spare production capacity. With the risk of shortages greatly reduced, prices have lost their risk premia and are tending toward marginal production costs to rebalance markets.
To move to the next phase of the cycle, an acceleration in global output growth will be required to boost raw material demand by enough to stabilise metal inventories or utilise excess capacity.
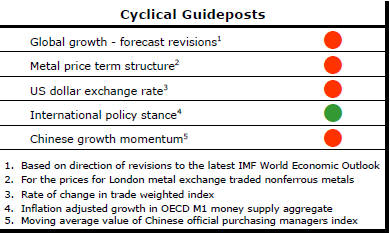
The PortfolioDirect cyclical
guideposts suggest that the best possible macroeconomic circumstances for
the resources sector will involve a sequence of upward revisions to
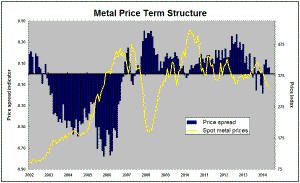
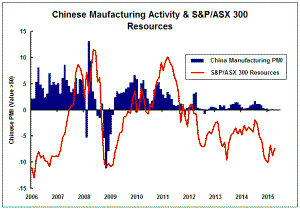
global growth forecasts, the term structure of metal prices once again
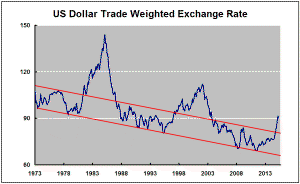
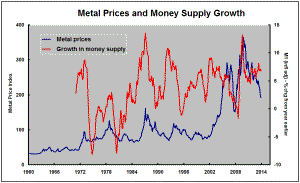
reflecting rising near term shortages, a weakening US dollar, strong money
supply growth rates and positive Chinese growth momentum. Only one of
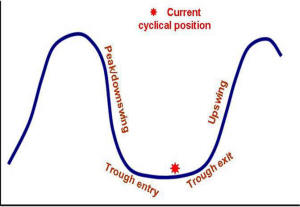
the five guideposts is "set to green" suggesting the sector remains confined
to the bottom of the cycle .
Has Anything Changed?
Throughout 2014, PortfolioDirect had been characterising the cyclical position as ’Trough Entry’ with some expectation that by the end of 2015 an exit would be evident. Until very late in the year, the evidence supported that possibility before conditions took several backward steps.
The absence of a growth acceleration among the major economic regions other than the USA is contributing to the flagging momentum. A stronger US dollar is also imparting a downward bias to US dollar denominated prices presently. This is looking less like a temporary move than a multiyear change of direction.
The ECB has foreshadowed more monetary stimulus measures. However, monetary polices supporting asset prices alone are unable to directly affect growth sufficiently to encourage a better outlook for resource sector equities.
Fears about the impact of low oil prices have affected sentiment adversely. The beneficial effect of lower oil prices on demand within the advanced economies has not yet been felt and is still being underestimated as a source of additional output growth.
US Loses Growth Momentum
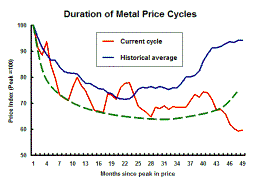
Signs that the US economy is losing its growth momentum are reminiscent of
earlier episodes of momentum loss that have peppered the current cycle
before a relatively quick improvement has occurred.
Analytical evidence that estimates of US first quarter
GDP tend to be unusually weak, even after seasonal adjustment, has
encouraged some commentators to discount the near term growth results.
However, signs of a slippage in the pace of growth going into the second
quarter are more worrying.
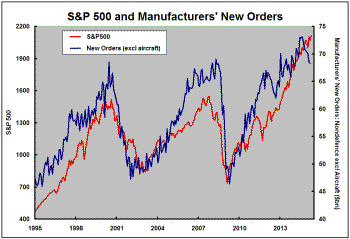
Labour market statistics continue to imply a robust expansion but the data on manufacturers new orders released last week showing the seventh consecutive monthly decline have caused some reappraisal of the pace of growth.
Business investment spending has been noticeably weaker throughout the recovery than in earlier cycles. Additional pressures on spending have arisen in recent months from the fall in oil prices which has caused a reduction in the amount of spending on machinery and equipment used by the sector. The stronger US dollar would also have crimped demand for US goods from overseas buyers and import competing domestic industries.
The chart shows the history of durable goods orders (excluding defence purchases and aircraft) since 1995 and the associated movements in the S&P 500. For the time being, at least, the equity market has been willing to ignore the weakness in capital spending. This is consistent wit its reaction throughout the cycle as weakness in activity has been taken as a sign of the Fed adding support for the market or delaying expected rises in interest rates.
In the past week, higher oil prices and a slight stalling in exchange rate appreciation may have taken some of the edge off the negative pressures which might have otherwise held markets back.
Improved Financial Market Risk Appetite
There has been a slight improvement in financial market risk appetite which
would normally benefit resource sector investment outcomes.
The chart illustrates, using the Australian small
resources share price index (shown in red) and the spread between CCC rated
US corporate bond yields and US government 10 year bond yields, how resource
sector equity values have normally varied inversely with the cost of
finance. 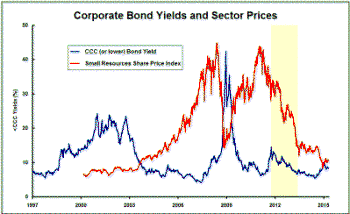
The yellow highlighted portion of the chart covers the period in which the relationship breaks down conspicuously. Falling yield spreads coincided with falling equity market values between October 2011 and May 2013. This included the period after September 2012 when the Federal Reserve began the second phase of its intervention in financial markets in response to unusually weak global output growth.
Since then, the more usual relationship seems to have been restored. Initially, falling financing costs helped support market prices before another interest rate rise coincided with the downward plunge in equity prices during the second half of 2014. Very recently, slightly easier financial conditions have helped to once again stabilise prices.
Since the yield spreads remain toward the lower end of their historical range, it is hard to foresee them falling by enough to be the source of a strong upward move in equity prices of the sort which kicked off the last cycle in 2003. I