The Current View
Growth in demand for raw materials peaked in late 2010. Since then, supply growth has continued to outstrip demand leading to inventory rebuilding or spare production capacity. With the risk of shortages greatly reduced, prices have lost their risk premia and are tending toward marginal production costs to rebalance markets.
To move to the next phase of the cycle, an acceleration in global output growth will be required to boost raw material demand by enough to stabilise metal inventories or utilise excess capacity.
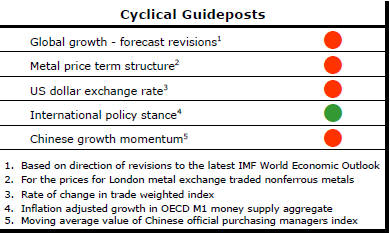
The PortfolioDirect cyclical
guideposts suggest that the best possible macroeconomic circumstances for
the resources sector will involve a sequence of upward revisions to
global growth forecasts, the term structure of metal prices once again
reflecting rising near term shortages, a weakening US dollar, strong money
supply growth rates and positive Chinese growth momentum. Only one of
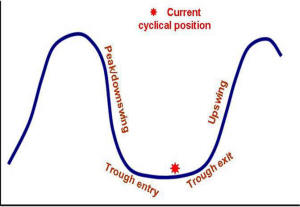
the five guideposts is "set to green" suggesting the sector remains confined
to the bottom of the cycle .
Has Anything Changed?
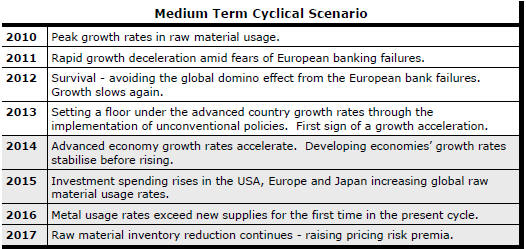
Throughout 2014, PortfolioDirect had been characterising the cyclical position as ’Trough Entry’ with some expectation that by the end of 2015 an exit would be evident. Until very late in the year, the evidence supported that possibility before conditions took several backward steps.
The absence of a growth acceleration among the major economic regions other than the USA is contributing to the flagging momentum. A stronger US dollar is also imparting a downward bias to US dollar denominated prices presently. This is looking less like a temporary move than a multiyear change of direction.
Early 2015 evidence suggests that growth in the USA, too, might be slowing with the stronger US dollar affecting activity.
US Inventory Movements Signal
Momentum Loss
The US Department of Commerce has reported a very slight reduction in
business inventories in March from 1.37% of sales to 1.36%. As the chart
illustrates, the fall is insignificant against the backdrop of the
relatively rapid rise, which occurred in the second half of 2014, and the
upward trend which dates from early 2011.
Rising inventories can be interpreted as a sign of economic strength if improving business optimism results in companies being prepared to carry more stock. On the other hand, an involuntary inventory rise due to lower than expected sales would normally presage economic weakness.
Taken with other indicators of US economic activity, the inventory movements appear consistent with weaker than expected business conditions. An eventual rundown in inventories to more acceptable levels will subtract from overall US economic growth providing further reasons for scepticism about the possibility of a near term global growth acceleration.
Brazil Still Battling Recession
Brazil has been stung by the collapse of commodity prices while also
suffering from structural impediments to stronger growth which had been
papered over by higher commodity prices.
 The
position of Brazil is symptomatic of the malaise facing a swathe of
developing economies. China, Russia, India, Turkey and a host of other
economies are failing to meet the growth challenge. Of the principal
developing economies, India is one of the few currently showing meaningful
signs of improvement.
The
position of Brazil is symptomatic of the malaise facing a swathe of
developing economies. China, Russia, India, Turkey and a host of other
economies are failing to meet the growth challenge. Of the principal
developing economies, India is one of the few currently showing meaningful
signs of improvement.
In only one out of the seven months to March has Brazilian industrial output expanded. Over the 12 months to March, industrial production has fallen by 6.8%.
Last week, the Brazilian government signed trade and investment deals with the visiting Chinese premier worth an estimated US$50 billion designed to speed development and enhance economic links between the two nations. While Brazil will welcome the financial attention as a means of bolstering its flagging economy, the Chinese involvement with Brazil reflects its own attempts to widen its sphere of influence by engaging with several South American nations of which Brazil happens to be the largest.
Slowing Metal Market Adjustments
Several indicators of raw material usage released in the last few days add
to the evidence of a slowing cyclical adjustment in metal markets. The
change in tempo is not surprising since metal markets usually need an
acceleration in global growth to perform at their best.
The World Steel Association has reported that global
steel output in the first four months of 2015 fell 1.7% and Chinese production declined 1.2% compared
with the corresponding period a year earlier. The
International Lead Zinc Study Group has reported a 2.3% increase in zinc
metal usage in the first three months of 2015. The 74,000 tonne increase
was swamped by a 261,000 tonne increase in metal production. The
International Copper Study Group reported a 3.5% decline in copper usage
over the first two months of the year but a 5.0% increase in refined metal
production.
four months of 2015 fell 1.7% and Chinese production declined 1.2% compared
with the corresponding period a year earlier. The
International Lead Zinc Study Group has reported a 2.3% increase in zinc
metal usage in the first three months of 2015. The 74,000 tonne increase
was swamped by a 261,000 tonne increase in metal production. The
International Copper Study Group reported a 3.5% decline in copper usage
over the first two months of the year but a 5.0% increase in refined metal
production.
While still early in the year, these indicators of market conditions are broadly consistent as they suggest delays in inventory adjustments which were expected to underpin higher prices. The zinc market is probably the market segment most vulnerable to a change in expectations. .