The Current View
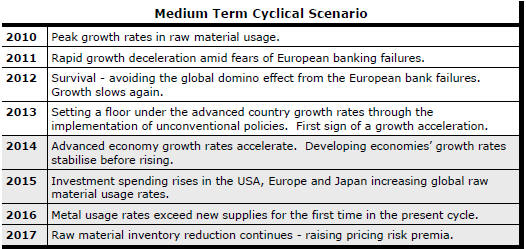
Growth in demand for raw materials peaked in late 2010. Since then, supply growth has continued to outstrip demand leading to inventory rebuilding or spare production capacity. With the risk of shortages greatly reduced, prices have lost their risk premia and are tending toward marginal production costs to rebalance markets.
To move to the next phase of the cycle, an acceleration in global output growth will be required to boost raw material demand by enough to stabilise metal inventories or utilise excess capacity.
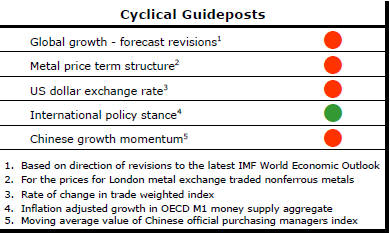
The PortfolioDirect cyclical
guideposts suggest that the best possible macroeconomic circumstances for
the resources sector will involve a sequence of upward revisions to
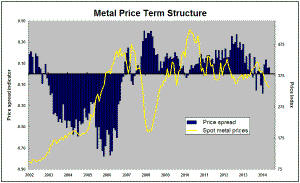
global growth forecasts, the term structure of metal prices once again
reflecting rising near term shortages, a weakening US dollar, strong money
supply growth rates and positive Chinese growth momentum. Only one of
the five guideposts is "set to green" suggesting the sector remains confined
to the bottom of the cycle .
Has Anything Changed?
Throughout 2014, PortfolioDirect had been characterising the cyclical position as ’Trough Entry’ with some expectation that by the end of 2015 an exit would be evident. Until very late in the year, the evidence supported that possibility before conditions took several backward steps.
The absence of a growth acceleration among the major economic regions other than the USA is contributing to the flagging momentum. A stronger US dollar is also imparting a downward bias to US dollar denominated prices presently. This is looking less like a temporary move than a multiyear change of direction.
The ECB has foreshadowed more monetary stimulus measures. However, monetary polices supporting asset prices alone are unable to directly affect growth sufficiently to encourage a better outlook for resource sector equities.
Fears about the impact of low oil prices have affected sentiment adversely. The beneficial effect of lower oil prices on demand within the advanced economies has not yet been felt and is still being underestimated as a source of additional output growth.
IMF Holds Growth Outlook Steady
PortfolioDirect has been using the momentum of the International Monetary
Fund (IMF) global growth revisions as an important indicator of cyclical
positioning for the resources sector. Without an acceleration in global
growth, a cyclical recovery for the sector is unlikely.
 For
the first time since 2010, the IMF has raised its forecasts - a positive
sign - but only by 0.1 percentage point for 2016. The forecast for 2015 is
unchanged. Among the advanced economies, upward revisions for growth in
Europe and Japan have been offset by lower growth elsewhere. Among the
emerging markets, large upward revisions for India are offset by cuts to
forecasts for Russia, Latin America and Africa.
For
the first time since 2010, the IMF has raised its forecasts - a positive
sign - but only by 0.1 percentage point for 2016. The forecast for 2015 is
unchanged. Among the advanced economies, upward revisions for growth in
Europe and Japan have been offset by lower growth elsewhere. Among the
emerging markets, large upward revisions for India are offset by cuts to
forecasts for Russia, Latin America and Africa.
A critical emerging issue has been a reassessment by the Fund of potential global growth - a potential negative for the resources sector - which it sees as having fallen in both advanced and emerging economies. The Fund's starting point for growth in 2016 is lower than for any year other than 2010. The expected future acceleration is now very modest by historical standards.
Greater Confidence about European Growth
Expectations
Staff economists at the European Central Bank have become markedly more
optimistic about European growth prospects over the past few months. They
are forecasting a mean euro area GDP expansion of 1.5% in 2015 increasing to
1.9% and 2.1% in the following two years. As recently as December, they had
been expecting 1.0% in 2015 and 1.5% in 2016.
 The
more optimistic tone has come from lower oil prices, a weaker currency
helping competitiveness and the impact of the ECB’s monetary policies.
The
more optimistic tone has come from lower oil prices, a weaker currency
helping competitiveness and the impact of the ECB’s monetary policies.
The staff is more optimistic than the non-official consensus. A quarterly survey of 59 European forecast professionals completed in the first week of April showed a mean growth expectation of 1.4% in 2015 rising to 1.8% in 2017, increases of between 0.1 and 0.3 percentage points from a quarter earlier.
Resource sector investment strategy is a constant search for growth momentum. These forecast revisions signal rising confidence about the future that has largely been absent from global markets. It is not enough but is a welcome move in the right direction.
Growing Importance of Advanced Economy
Investment
A rebound in the importance of investment spending in advanced economy
output expected by the International Monetary Fund will be critical to the
fortunes of the mining industry over the coming five years.
The half yearly World Economic Outlook released last week by the IMF showed the investment contribution to GDP in emerging economies as having stopped rising while the investment contribution in the advanced economies is expected to push higher, albeit from historically low levels, in 2015 and beyond.
Relying heavily on private sector decisions, advanced economy investment spending is more discretionary and potentially variable than emerging economy development spending.
 Not
surprisingly, when the investment contribution is rising, the metal
intensity of overall output is increasing raw material usage rates are at
their strongest. This connection is highlighted in the chart showing global
steel production and changes in the investment intensity of global GDP since
1980. Other factors are also at work but variations in the investment
contribution make an important difference to the momentum of raw material
consumption growth.
Not
surprisingly, when the investment contribution is rising, the metal
intensity of overall output is increasing raw material usage rates are at
their strongest. This connection is highlighted in the chart showing global
steel production and changes in the investment intensity of global GDP since
1980. Other factors are also at work but variations in the investment
contribution make an important difference to the momentum of raw material
consumption growth.