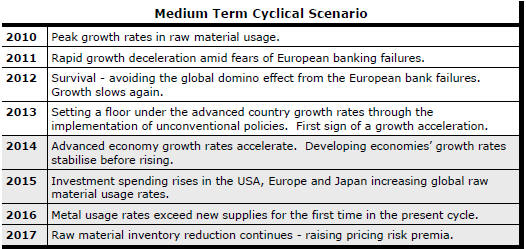
The Current View
Growth in demand for raw materials peaked in late 2010. Since then, supply growth has continued to outstrip demand leading to inventory rebuilding or spare production capacity. With the risk of shortages greatly reduced, prices have lost their risk premia and are tending toward marginal production costs to rebalance markets.
To move to the next phase of the cycle, an acceleration in global output growth will be required to boost raw material demand by enough to stabilise metal inventories or utilise excess capacity.
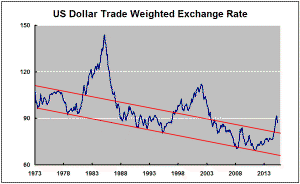
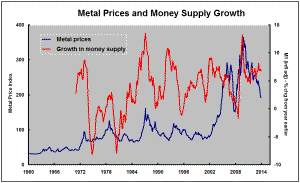
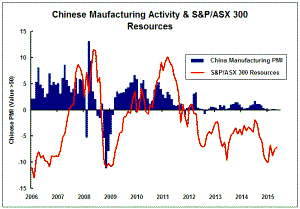
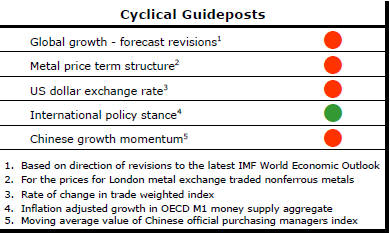
The PortfolioDirect cyclical
guideposts suggest that the best possible macroeconomic circumstances for
the resources sector will involve a sequence of upward revisions to
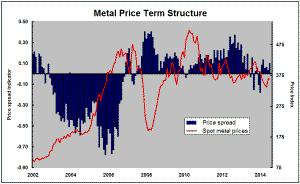
global growth forecasts, the term structure of metal prices once again
reflecting rising near term shortages, a weakening US dollar, strong money
supply growth rates and positive Chinese growth momentum. Only one of
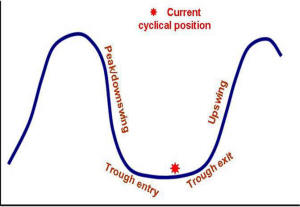
the five guideposts is "set to green" suggesting the sector remains confined
to the bottom of the cycle .
Has Anything Changed?
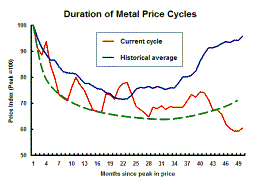
Throughout 2014, PortfolioDirect had been characterising the cyclical position as ’Trough Entry’ with some expectation that by the end of 2015 an exit would be evident. Until very late in the year, the evidence supported that possibility before conditions took several backward steps.
The absence of a growth acceleration among the major economic regions other than the USA is contributing to the flagging momentum. A stronger US dollar is also imparting a downward bias to US dollar denominated prices presently. This is looking less like a temporary move than a multiyear change of direction.
Early 2015 evidence suggests that growth in the USA, too, might be slowing with the stronger US dollar affecting activity.
European GDP Sustainable but no Acceleration
Euro area GDP expanded by 0.4% in the March quarter and by 1.0% over the
year to the end of March. The eighth consecutive quarter of GDP growth
suggests that the euro area is now expanding sustainably after the 2012-13
recession in the aftermath of the region's sovereign debt crisis.
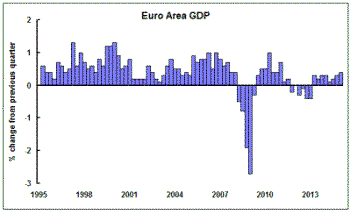
From a resource sector investment standpoint, the region's improved growth outcomes are helping sustain demand for raw materials although a strong upswing in raw material demand still depends on an acceleration in output growth.
The upswing in Europe appears to have largely run out of steam during 2014 with German growth now slackening as growth elsewhere picks up.
Further monetary stimulus - leading to stronger rates of investment spending as borrowing conditions ease - may help to raise the growth tempo eventually but, consistent with the experience in the USA and Japan, the reaction time remains uncertain and the size of the impact on investment spending unclear.
Momentum Signals Getting Weaker
The resource sector strategist's ongoing search for output growth momentum
is not looking good.
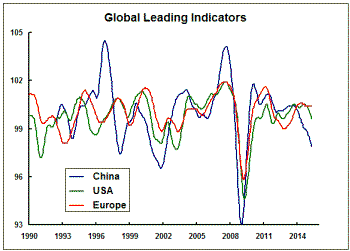
The latest leading indicators (for March) published by the OECD show most of the key economic regions either running below potential already or heading toward lower growth rates in the future.
Driven primarily by a loss of momentum in the USA and higher but stabilising growth in Europe, the G7 growth indicator has started to lose traction.
China is already below trend and going lower. India has been growing below trend but heading higher.
Overall, these indicators are consistent
with raw material usage rates in 2015 being little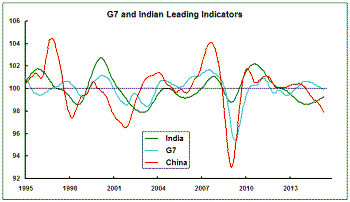 different from those in 2014 and, as a consequence, are foreshadowing a
slowing in the process of inventory or capacity utilisation adjustment in
the resources industry. Such an inference about raw material use is
consistent with the statistics covering the early months of 2015 published
to date.
different from those in 2014 and, as a consequence, are foreshadowing a
slowing in the process of inventory or capacity utilisation adjustment in
the resources industry. Such an inference about raw material use is
consistent with the statistics covering the early months of 2015 published
to date.
Productivity Losses Becoming Critical
Statistics from the US Bureau of Labor Statistics showed a fall in labour productivity in the March quarter and growth of only 0.6% over the
four quarters to the end of March 2015. Labour productivity has been
tending lower throughout the 2000s but, even so, has been rising at an
average pace of 1.8% a year during this period. The most recent outcomes
are well below trend.
The chart shows real unit labour costs for the non farm business sector of the US economy. This statistic brings together labour productivity, compensation and prices. Falling real unit labour costs are an indicator of business margin expansion at the macro level.
Th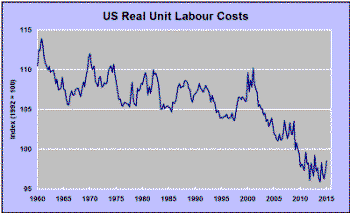 e
change in direction during the 2000s has been dramatic and consistent with a
re-pricing of US equities. Most recently, however, the forward momentum has
been lost. This important source of improved business performance is not as
powerful as it used to be.
e
change in direction during the 2000s has been dramatic and consistent with a
re-pricing of US equities. Most recently, however, the forward momentum has
been lost. This important source of improved business performance is not as
powerful as it used to be.
Stronger wages growth - widely considered desirable to encourage higher rates of consumption spending - would result in a rise in unit labour costs and downward pressure on business profits without an increase in productivity. This becomes of even greater importance as the US market has less monetary stimulus on which to rely for share price appreciation.