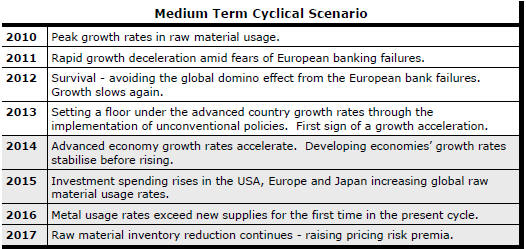
The Current View
Growth in demand for raw materials peaked in late 2010. Since then, supply growth has continued to outstrip demand leading to inventory rebuilding or spare production capacity. With the risk of shortages greatly reduced, prices have lost their risk premia and are tending toward marginal production costs to rebalance markets.
To move to the next phase of the cycle, an acceleration in global output growth will be required to boost raw material demand by enough to stabilise metal inventories or utilise excess capacity.
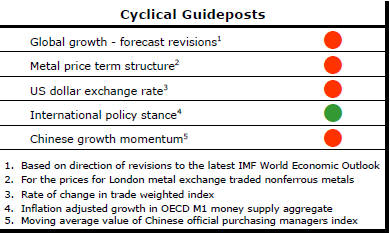
The PortfolioDirect cyclical
guideposts suggest that the best possible macroeconomic circumstances for
the resources sector will involve a sequence of upward revisions to
global growth forecasts, the term structure of metal prices once again
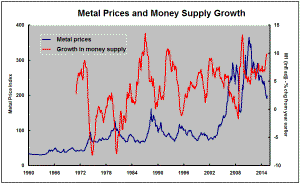
reflecting rising near term shortages, a weakening US dollar, strong money
supply growth rates and positive Chinese growth momentum. Only one of
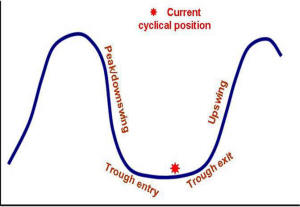
the five guideposts is "set to green" suggesting the sector remains confined
to the bottom of the cycle .
Has Anything Changed?
Throughout 2014, PortfolioDirect had been characterising the cyclical position as ’Trough Entry’ with some expectation that by the end of 2015 an exit would be evident. Until very late in the year, the evidence supported that possibility before conditions took several backward steps.
The absence of a growth acceleration among the major economic regions other than the USA is contributing to the flagging momentum. A stronger US dollar is also imparting a downward bias to US dollar denominated prices presently. This is looking less like a temporary move than a multiyear change of direction.
Early 2015 evidence suggests that growth in the USA, too, might be slowing with the stronger US dollar affecting activity.
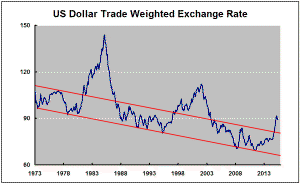
High Metal Price or Exchange Rate; Not Both
The inverse correlation between movements in the US dollar and US dollar
denominated commodity prices is often mentioned in passing but far less
frequently considered explicitly in price forecasts.
Company executives appear especially oblivious to the
importance of the connection when talking about the future direction of
commodity prices despite its historical clarity. Feasibility studies can
sometimes assume both rising prices and a rising US dollar.

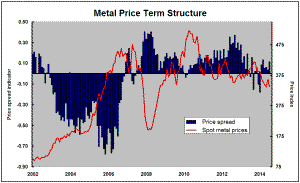
The chart illustrates the relationship using the International Monetary Fund metal price index (in the red line) and the US dollar trade weighted exchange rate (shown in blue). Since December 2011, the IMF metal price index has fallen 38% while the currency has risen 23%.
Turning points in the series are conspicuously close over the entire 35 years of data shown here, including even a relatively small change in the last month. A coincident rise in both metal prices and the exchange rate is unprecedented and, consequently, highly unlikely through the current cycle.
Analytically, breaking the nexus would require a strong enough acceleration in global output growth to overpower the negative currency effect. From the current starting point, a broadly based acceleration in growth would most likely come with appreciating non-US dollar currencies.
For metal prices to be rising while the currency is also going up, US growth alone would have to be strong enough to rebalance commodity markets while the rest of the world floundered. Probably not.
New World Bank Growth Forecasts
The World Bank released its global growth forecasts for the 2015-17 period.
Headlines referring to a growth downgrade were only partially accurate.
The forecast for 2015 was taken down from 3.0% in January to 2.8% in the latest review. A larger revision had already occurred when the forecast was cut from 3.4% to 3.0%. A 3.3% forecast for 2016 was retained so there was no cut in the forecast for the upcoming year.
The World Bank continues to foresee a growth acceleration from 2.6% in 2014 to 3.3% in 2016. Unfortunately, as with other forecasters over recent years, the Bank has had to wind back higher numbers as the forecast period draws closer.
The search for growth momentum - the key ingredient to keep moving along the commodity price cycle - remains frustratingly slow.
On the numbers from the World Bank, growth is expected to be stronger in 2017 than in 2014 in Europe, Japan and Russia. That would make a welcome change but each faces structural impediments to achieving something better than the near recessionary rates currently or recently prevailing. Latin America and the Caribbean and the Middle East and Africa are also expected to do better. Among the western hemisphere group of countries, much depends on Brazil coming out of its recession.
India's growth, according to the Bank, will not improve greatly but it is conspicuously above 7.5% over the forecast period offering a chance that there is a successor to China as a contributor to an eventual above average outcome.
World Bank Gets It Wrong on Mining Industry
Conditions
The June 2015 edition of Global Economic Prospects published by the World
Bank describes a set of business conditions for small resource companies
many would not recognise. A special supplement to the Bank's periodic
review of global economic conditions discusses the impact on low income
countries of the commodities boom and its aftermath.
Despite the Bank forecasting an acceleration in global growth, it appears unimpressed by the prospects for a cyclical recovery in raw material prices within the foreseeable future. Since investment relies on higher prices, some years will pass before a response in sector activity, according to the Bank.
The Bank has described how junior companies have taken over from large transnational companies as risk takers at the forefront of exploration. The bank is right, too, in saying that spending by juniors is driven primarily by the availability of funding. However, the Bank seems to have overestimated the benefit from "easy global financing conditions in recent years". Its conclusion that future rises in financing costs will act to curtail exploration and development may also be erroneous.
Headline interest rates have provided little insight into the costs and availability of funding for explorers and early stage project developers in recent years. There has been a sharp disconnect between the two with larger investors able to use their considerable financial leverage to extract some exceedingly favourable lending terms and conditions in exchange for the finance they provide.
As economic conditions improve - with stronger growth rates, higher interest rates and, possibly, a weaker US dollar - the availability of finance for the mining sector could possibly improve rather than deteriorate.