The Current View
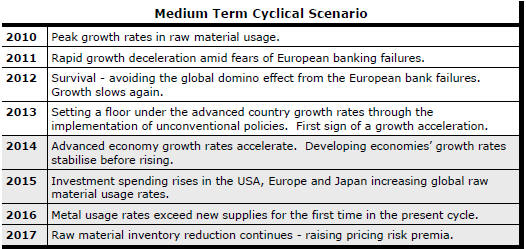
Growth in demand for raw materials peaked in late 2010. Since then, supply growth has continued to outstrip demand leading to inventory rebuilding or spare production capacity. With the risk of shortages greatly reduced, prices have lost their risk premia and are tending toward marginal production costs to rebalance markets.
To move to the next phase of the cycle, an acceleration in global output growth will be required to boost raw material demand by enough to stabilise metal inventories or utilise excess capacity.
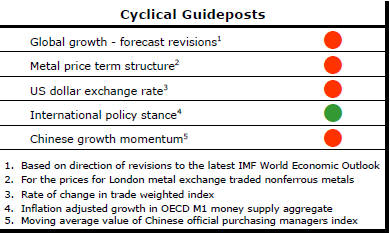
The PortfolioDirect cyclical
guideposts suggest that the best possible macroeconomic circumstances for
the resources sector will involve a sequence of upward revisions to
global growth forecasts, the term structure of metal prices once again
reflecting rising near term shortages, a weakening US dollar, strong money
supply growth rates and positive Chinese growth momentum. Only one of
the five guideposts is "set to green" suggesting the sector remains confined
to the bottom of the cycle .
Has Anything Changed?
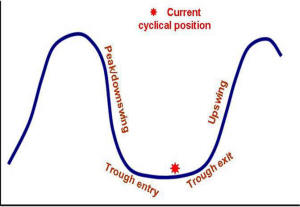
Throughout 2014, PortfolioDirect had been characterising the cyclical position as ’Trough Entry’ with some expectation that by the end of 2015 an exit would be evident. Until very late in the year, the evidence supported that possibility before conditions took several backward steps.
The absence of a growth acceleration among the major economic regions other than the USA is contributing to the flagging momentum. A stronger US dollar is also imparting a downward bias to US dollar denominated prices presently. This is looking less like a temporary move than a multiyear change of direction.
Early 2015 evidence suggests that growth in the USA, too, might be slowing with the stronger US dollar affecting activity.
More Liquidity for the Australian Market
For more than three decades, Australian interest rates were raised while
labour market conditions (shown in the chart as a declining unemployment
rate) were tightening and reduced again in response to a rise in
unemployment. While the amplitude of the interest rate shifts was greatly
reduced through the 1990s as rates were kept relatively low to take account
of labour market slack in the aftermath of recession, the same connection
generally prevailed.
The most recent cut in official interest rates has occurred despite the unemployment rate having stabilised at a relatively low level but the decision making process has become more complicated.
Global pressures have taken over from predominantly domestic influences on interest rate settings.
The full effect of slow economic growth and weaker commodity prices may not have fully impacted the Australian economic performance. Unemployment may resume rising in which case further interest rate reductions may be warranted. Low inflation internationally has meant reduced pressure on prices generally for any degree of labour market improvement. Global exchange rate movement have left Australia vulnerable to a loss of competitiveness in the event steps are not taken to encourage a deprecation of the Australian dollar.
Under these circumstances, Australian equity markets could continue to receive a liquidity boost from policy change in the same way as in the USA, Europe, Japan and China with a correspondingly reduced regard for valuations.
US Consumption Spending
Post-2010 growth in US consumption spending has displayed a markedly
different profile than prior to 2008. The upper end of more recent growth
outcomes has coincided with the lower end of outcomes over nearly two
decades after 1990.
 The
3.0% growth in expenditure over the 12 months ended in March 2015 is among
the lowest growth achieved at any time outside the 2008-9 financial crisis.
Not only is growth low by historical standards but there is also little hint
of an improvement in momentum suggesting limited prospects for an uplift in
overall economic growth rates since consumption spending accounts for
two-thirds of US GDP.
The
3.0% growth in expenditure over the 12 months ended in March 2015 is among
the lowest growth achieved at any time outside the 2008-9 financial crisis.
Not only is growth low by historical standards but there is also little hint
of an improvement in momentum suggesting limited prospects for an uplift in
overall economic growth rates since consumption spending accounts for
two-thirds of US GDP.
The investment importance of this outcome rests on the largest global economy being presently unable to support the acceleration in global growth outcomes needed to spur rates of raw material use.
Something's Spooked the Bond Markets
After a steady downward track in bond yields since the beginning of 2014
with consequentially positive impacts on equity prices, there has been a
dramatic change in direction.
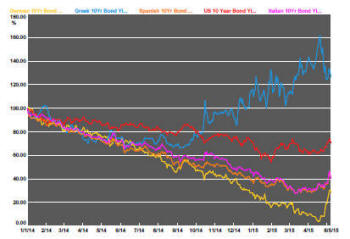
The German bund whose 10 year yield dropped to as low as 0.07% on 20 April led the way. To some degree, the change in direction might reflect a trading anxiety about how low yields had gone and whether such low rates could persist. To that extent, a reversal of the recent rises may be possible.
In Europe, the movement might also reflect a reappraisal of the Greek propensity to default and disrupt financial markets there.
More broadly, uncertainties about the nature of the European Union will have begun to surface as the UK election campaign draws to a conclusion with a commitment by the Conservative Party and demands by others for renegotiation of terms and a vote on membership.
A change in the strength of belief about European recovery may also be behind some of the move.
Financial markets are generally more sensitive to changes in risk perception. Whatever their source, the strong bond market reaction suggests that those most attuned to risk are saying it has risen.