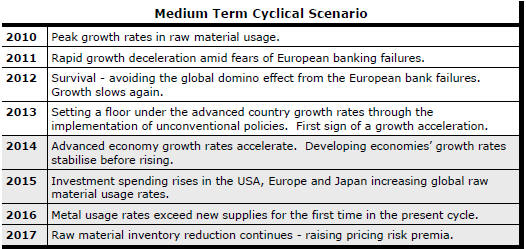
The Current View
Growth in demand for raw materials peaked in late 2010. Since then, supply growth has continued to outstrip demand leading to inventory rebuilding or spare production capacity. With the risk of shortages greatly reduced, prices have lost their risk premia and are tending toward marginal production costs to rebalance markets.
To move to the next phase of the cycle, an acceleration in global output growth will be required to boost raw material demand by enough to stabilise metal inventories or utilise excess capacity.
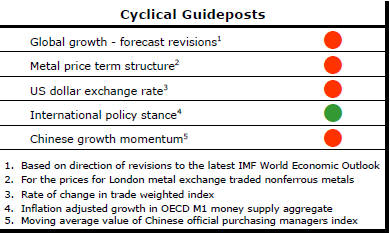
The PortfolioDirect cyclical
guideposts suggest that the best possible macroeconomic circumstances for
the resources sector will involve a sequence of upward revisions to
global growth forecasts, the term structure of metal prices once again
reflecting rising near term shortages, a weakening US dollar, strong money
supply growth rates and positive Chinese growth momentum. Only one of
the five guideposts is "set to green" suggesting the sector remains confined
to the bottom of the cycle .
Has Anything Changed?
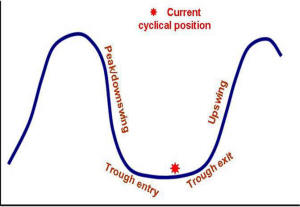
Throughout 2014, PortfolioDirect had been characterising the cyclical position as ’Trough Entry’ with some expectation that by the end of 2015 an exit would be evident. Until very late in the year, the evidence supported that possibility before conditions took several backward steps.
The absence of a growth acceleration among the major economic regions other than the USA is contributing to the flagging momentum. A stronger US dollar is also imparting a downward bias to US dollar denominated prices presently. This is looking less like a temporary move than a multiyear change of direction.
Early 2015 evidence suggests that growth in the USA, too, might be slowing with the stronger US dollar affecting activity.
Signs of Cyclical Improvements
Non ferrous metal prices showed their strongest gains in over 10 months
during the last days of April. The recent improvement in prices will be
welcome relief for companies and may spur some renewed investor interest in
the sector.
Working against that outcome are two aspects of the cyclical positioning. The chart tracking the cyclical positioning of the sector shown on this page emphasises the extent to which prices remain below their cyclical peak values. Just as importantly, the chart also illustrates the wide gap between current prices and where they might have been so far into earlier price cycles.
Sentiment is likely to remain poor while gaps of these sizes persist. Further price gains will be needed before widening confidence about the cyclical positioning of the sector leads to fresh investment commitments to sector equities.
Two influences could help explain the rise in prices in the past week. Non-ferrous prices had been overly influenced by oil and iron ore market conditions and exchange rate movements added impetus.
Non-ferrous metal markets might have become too caught up in what was happening elsewhere and too pessimistic about their specific circumstances. Before oil prices and iron ore prices weakened in late 2014, there had been encouraging signs that the process of market rebalancing in the non-ferrous sector was underway. The notes below refer to the copper market as an example of this.
The term structure of metal prices illustrated in one of the charts opposite also suggested an improvement in cyclical conditions. Unsurprisingly, there was again some narrowing of forward spreads during April in support of higher spot prices
Falling oil prices and iron ore prices pulled the rug from under metal market sentiment as inferences were drawn from what was happening to these high profile market benchmarks about the outlook for global growth.
There is now a broader understanding that the change in iron ore and oil market conditions were more indicative of supply side management problems and that the non-ferrous markets may be the better indicators of global economic conditions. At the same time, both oil and iron ore prices have shown sufficient improvement recently to remove some of the downward pressure on the sector more broadly.
Exchange rate movements have also helped. The fall in the US dollar in April was the first monthly fall since June 2014. Despite that, the currency remains at elevated levels and vulnerable to a resumption of its rising trajectory with consequential adverse implications for the direction of US dollar denominated commodity prices.
Chinese Momentum Absent
The Chinese manufacturing purchasing managers index for April has continued
to show Chinese manufacturing on the ridge between expansion and
contraction. Commentators will try to read as much as they can into each
monthly release but the chart probably illustrates the key implications most
clearly. The blue bars show the deviation of the monthly index from a
reading of 50 points. The result over the past several months is barely
visible on the chart. There has been no sign of a change in trajectory let
alone a return to the more buoyant readings of earlier years. Viewed against
the backdrop of what has been required to move sector equity values in the
past, investors are not able to count on an equity market impetus from
China.
Copper Inventories Point to Tight Market
The copper market continues to look as though it is in as good a shape as at
any time over the past four or five decades. The chart shows the end of
year copper metal inventory data published by the International Copper Study
Group.
Inventories at the end of December 2014 were near the peak level for the cycle. Critically, however, historically strong growth in consumption has meant global stock holdings now represent one of the lowest proportions of overall usage experienced over the past 40 years. The inventory positioning belies some of the pessimism surrounding resource sector investment markets.
With inventories hovering near the equivalent of three weeks' consumption, only very minor changes to supply or demand could result in inventory outcomes which have historically been associated with strong cyclical conditions.
The critical ingredient remains a near term acceleration in economic activity which would bring with it a likely surge in metal use. Without that, the risk rises of little or no change in consumption in 2015 while metal supplies continue to rise. This would reverse the inventory tightening which has been evident over the past two years. This might be a case of near but not close enough.