The Current View
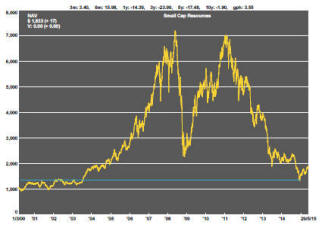
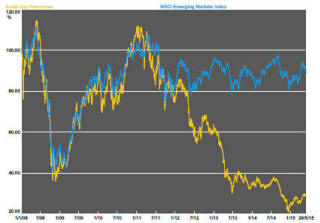
A lengthy downtrend in sector prices had given way to a relatively stable trajectory after mid 2013 similar to that experienced in the latter part of the 1990s and first few years of the 2000s.
The late 1990s and early 2000s was a period of macroeconomic upheaval during which time sector pricing nonetheless proved relatively stable. That remains a possible scenario for sector prices.
Relative stability suggests a chance for companies genuinely adding value through development success to see their share prices move higher. This was the experience in the late 1990s and early 2000s.
The lower equity prices fall - and the higher the cost of capital faced by development companies - the harder it becomes to justify project investments. The market is now entering a period prone to even greater disappointment about project delivery .
Has Anything Changed?
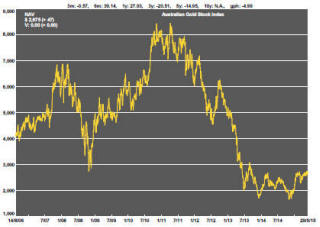
The assumption that June 2013 had been the cyclical trough for the market now appears premature.
Sector prices have adjusted to the next level of support. The parallel with the 1990s is being tested. Prices will have to stabilise around current levels for several months for the thesis to hold.
Key Outcomes in the Past Week
Volatility edged back as a market issue during the week. The S&P 500 volatility index increased 14%.
The possibility of a Greek debt default loomed again as yet another artificial deadline neared. debate about the likely impact of a rise in interest rates during the second half of 2015 added to market movements despite groundwork by fed governors to adjust expectations to the inevitability of a change.
Low US market Volatility Tests New Limits
While US equity prices have been hovering around near record levels, their
trading ranges have narrowed considerably. Slowing domestic demand and
anxiety about the effects of the first interest rate rises by the Federal
Reserve have been capping the upside. Corporate earnings growth (supported
by share buy-back programs) and highly accommodative monetary policy
settings have been preventing significant downside. Relatively high US
interest rates have also drawn overseas capital into US markets.
The chart shows the range in annual S&P 500 prices as a percentage of the opening value for each year since 1976. The final bar shows how the market has tracked so far during 2015. To date, volatility has been the lowest experienced during any year over this four decade period. One should expect volatility to rise from this point. Less certain is how a change in volatility will be effected. It could happen with prices moving in either direction. There are several potential sources of market disruption including current negotiations with the Greek government over its debt repayments and the impact on markets after the first rise in US interest rates by the Fed in the current cycle, assumed to occur in the second half of 2015.
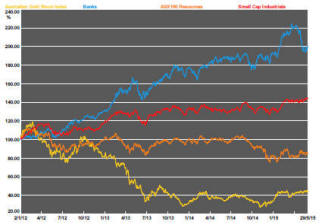
Bottom of the Cycle Leverage
During the week, the small resources share price index fell 0.6% and the
S&P/ASX 100 resources index rose 1.5% but neither changed significantly
during May. Both rose by less than 1% over the month. Falling sector
volatility has offered some leeway for individual companies to show initial
signs of recovery from cyclically low prices. In some cases, the near term
price gains have been as high as 20-30% or more albeit against the
background of prices having previously fallen by 80% or more.
With only a few exceptions, conditions have not yet improved sufficiently for companies to break away from historically entrenched trading bands some of which have now been intact for as long as four or five years.
More examples of bottom of the cycle leverage to improved sentiment should eventually combine to force higher index values. Continuing declines in market volatility will most likely be required to underpin this eventuality.
.
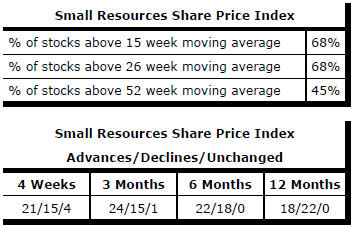
Market Breadth Statistics