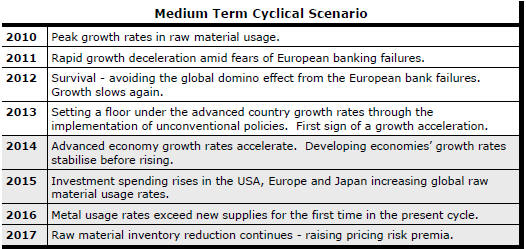
The Current View
Growth in demand for raw materials peaked in late 2010. Since then, supply growth has continued to outstrip demand leading to inventory rebuilding or spare production capacity. With the risk of shortages greatly reduced, prices have lost their risk premia and are tending toward marginal production costs to rebalance markets.
To move to the next phase of the cycle, an acceleration in global output growth will be required to boost raw material demand by enough to stabilise metal inventories or utilise excess capacity.
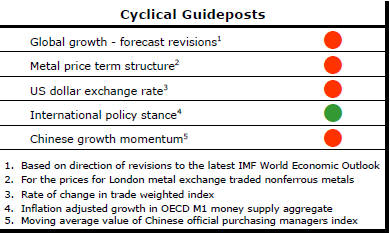
The PortfolioDirect cyclical
guideposts suggest that the best possible macroeconomic circumstances for
the resources sector will involve a sequence of upward revisions to
global growth forecasts, the term structure of metal prices once again
reflecting rising near term shortages, a weakening US dollar, strong money
supply growth rates and positive Chinese growth momentum. Only one of
the five guideposts is "set to green" suggesting the sector remains confined
to the bottom of the cycle .
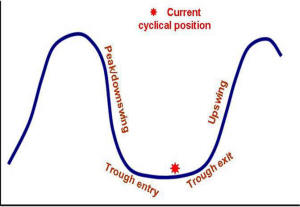
Has Anything Changed?
Throughout 2014, PortfolioDirect had been characterising the cyclical position as ’Trough Entry’ with some expectation that by the end of 2015 an exit would be evident. Until very late in the year, the evidence supported that possibility before conditions took several backward steps.
The absence of a growth acceleration among the major economic regions other than the USA is contributing to the flagging momentum. A stronger US dollar is also imparting a downward bias to US dollar denominated prices presently. This is looking less like a temporary move than a multiyear change of direction.
Early 2015 evidence suggests that growth in the USA, too, might be slowing with the stronger US dollar affecting activity.
Indicators of Weakening Conditions
At the end of May, the gap between current metal prices and the historical
benchmark against which PortfolioDirect judges cyclical
positioning had widened.
The flow of metal usage statistics, as reported in the PortfolioDirect report on 25 May 2015, is showing a strong possibility that growth in 2015 will be below average.
The widening spreads between cash and forward prices during May are consistent with weakening market conditions.
The upward trend in the US dollar also implies reduced scope for prices to rise unless, perhaps, they are simply adjusting to having previously overshot on the downside, as in the cases of iron ore and crude oil.
Those other commodities on a more mature cyclical path appear unable, for the time being, to withstand the pressures.
Japanese Exports Lead the Way
Japanese exports have been building momentum. Over the four quarters to the
end of March 2015, exports of goods and services have risen 7.3%, according
to the country's national account data.
Overall GDP, at the same time, contracted by 1.5%, led by a 4.1% decline in private consumption spending.
The gains in competitiveness from a weaker currency are not being matched by a sufficient rise in domestic demand to sustain a recovery in economic activity.
Slow growth in the rest of the world will continue as a constraint on the future growth in Japanese exports limiting the extent to which Japan's exporters will be able to carry the burden of lifting the national growth momentum.
Chinese Loan Growth Undiminished
China's central bank has reported that loans outstanding at the end of April
were 14% higher than they had been at the end of April 2014. The growth in
loans has changed little over the past five years despite sometimes dramatic
changes in underlying economic performance.
 The
recorded weakening in Chinese activity suggests that the proceeds of loans
are being used less efficiently than had been the case in the past. The
strength of lending suggests the possibility of structural impediments to an
acceleration in activity and a lesser likelihood that the financial system
is holding back spending. The lending numbers do not suggest an impending
boost from the financial system that might warrant a reappraisal of the
Chinese growth picture.
The
recorded weakening in Chinese activity suggests that the proceeds of loans
are being used less efficiently than had been the case in the past. The
strength of lending suggests the possibility of structural impediments to an
acceleration in activity and a lesser likelihood that the financial system
is holding back spending. The lending numbers do not suggest an impending
boost from the financial system that might warrant a reappraisal of the
Chinese growth picture.
Higher Oil Prices as Output Stabilises
Oil prices have been strengthening over the past month while production
rates have continued to rise. Sectarian fighting in the middle east has
raised the geopolitical risks for traders. Some may also have been looking
forward to a a scheduled meeting of OPEC in the coming week in the hope that
the organisation will take some action to cut world supplies (although this
appears unlikely).
The weekly rig count statistics released in the USA on Friday will have helped support prices since the drop of 10 in the number of operating rigs was slightly larger than expected. The continuing decline in the number of operating rates had already gone further than analysts had anticipated without any material impact on production. The near term ability of the industry to achieve further cuts in the number of rigs will have been greatly reduced with the most productive rigs now driving output.
The first sign of stabilising production has been evident from a close look at the weekly output data from the US government. The four week moving average production rate of 9.4 million barrels per day over the period ended 22 May was in line with the production rate in the week ended 20 March.