The Current View
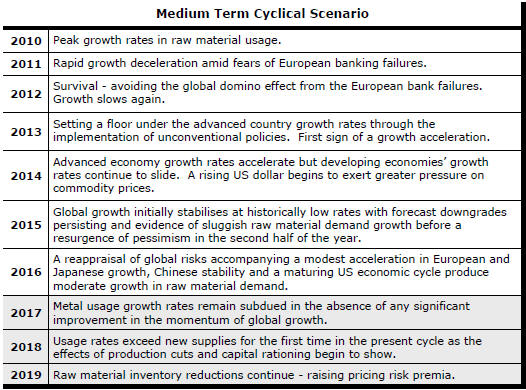
Growth in demand for raw materials peaked in late 2010. Since then, supply growth has generally outstripped demand leading to inventory rebuilding or spare production capacity. With the risk of shortages greatly reduced, prices lost their risk premia and have been tending toward marginal production costs to rebalance markets.
The missing ingredient for a move to the next phase of the cycle is an acceleration in global output growth which boosts raw material demand by enough to stabilise metal inventories or utilise excess capacity.
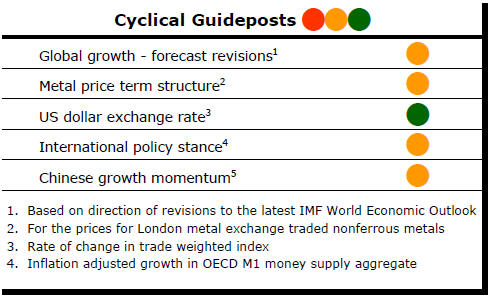
The PortfolioDirect cyclical
guideposts suggest that the best possible macroeconomic circumstances for
the resources sector will involve a sequence of upward revisions to
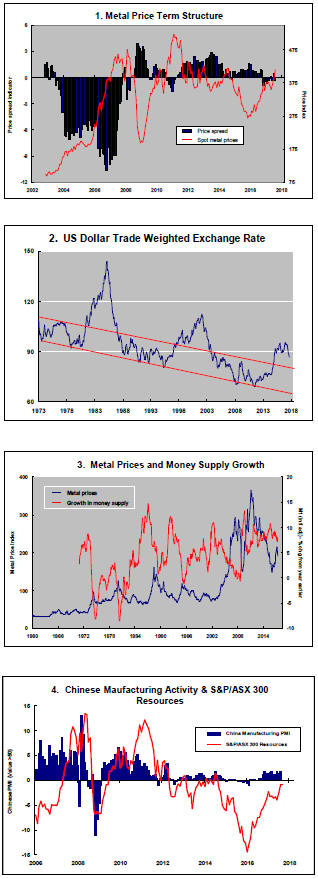
global growth forecasts, the term structure of metal prices once again
reflecting rising near term shortages, a weakening US dollar, strong money
supply growth rates and positive Chinese growth momentum. Only one of the five guideposts is "set to green"
(after the most recent adjustments in July 2017) suggesting the sector remains confined
to near the bottom of the cycle.
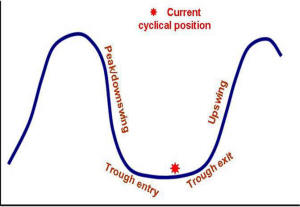
Has Anything Changed? - Updated View
From mid 2014, the metal market cyclical position was characterised as ‘Trough Entry’ with all but one of the PortfolioDirect cyclical guideposts - the international policy stance - flashing ‘red’ to indicate the absence of support.
Through February 2016, the first signs of cyclical improvement in nearly two years started to emerge. The metal price term structure reflected some moderate tightening in market conditions and the guidepost indicator was upgraded to ‘amber’ pending confirmation of further movement in this direction.
As of early December 2016, the Chinese growth momentum indicator was also upgraded to amber reflecting some slight improvement in the reading from the manufacturing sector purchasing managers index. Offsetting this benefit, to some extent, the policy stance indicator was been downgraded from green to amber.
The most recent change in cyclical guidepost positioning has been at the end of July 2017 when the exchange rate guidepost was upgraded to green.
Unappreciated Explorers Face Cyclically
Lower Prices
Small exploration companies face lower share prices even as they add value
to their tenements.
The PortfolioDirect index of the prices of 50 ASX-listed exploration stocks is 80% lower than at the beginning of 2011. Over the last six calendar years, the average index movement has been minus 16% with negative outcomes in five, including so far in 2017. The index is little changed since the end of 2013.
Since the beginning of June 2017, meanwhile, prices of the major daily traded non-ferrous metals have risen by as much as 40%. Iron ore prices have rebounded by nearly 50%. Coal prices are up just under 40%.
At the macro level, the price of low grade corporate debt - a sign of investor preparedness to assume risk - has continued on a rising trend.
The prices of the largest mining stocks - measured by the Euromoney global mining index - have gone up 27%.
Equity price leverage to improved industry conditions which should typify micro-cap companies trading at historically depressed prices has gone missing even as explorers pick up their activity rates.
The Australian Bureau of Statistics (ABS) reported earlier this month that the industry’s spending on Australian-based exploration was 26% higher in the June quarter than in the corresponding quarter in 2016.
The ABS data also showed that the number of metres drilled was 28% higher. Real activity was increasing at a rate similar to the rise in 2004 when a major cyclical shift was underway.
Against this background, the recent 11% rise in the prices of exploration stocks seems perplexingly weak. The equity market, at least so far, appears to be discounting heavily the benefits of current exploration efforts.
The most enthusiastic buying, in past cycles, has usually been spurred by anxiety over prices being higher in the future or stock being unobtainable. A prolonged cyclical trough has largely expunged this instinctive fear of missing out as a driver for sector engagement.
Also, among the hundreds of companies out looking, the incidence of transformative discoveries has been low. A lack of conspicuous success has broadcast an important message: there is no need for urgency.
More pointedly, investors are being conditioned to the idea that prices could be lower in the future.
The need for periodic injections of fresh capital to keep the corporate doors open and geologists in the field is promoting a self reinforcing cycle of lower prices.
Expectations of future capital raisings weigh constantly on share price performance. Discounted share entitlements encourage investors, at the margin, to sell existing holdings and replenish their positions at guaranteed lower prices. Selling pressures can persist after an issue if investors have taken up more than they intend to hold for the longer term or have been disappointed by the weight of issuance on market performance.
Some of these pressures can be averted by the introduction of new investors rather than having to rely on an existing shareholder base. This is easier said than done with sentiment toward the sector trailing so badly behind most other parts of the equity market.
Ironically, many of those investors best equipped financially and technically to support exploration and most reliant on mineral discoveries for future investment opportunities have been loath to fund exploration activity preferring to make larger investments at more advanced stages of development.
Even where funds raised are contributing to improvements in underlying value and raising the chance of an eventual mining development, investment returns may prove unattractive. When prices have fallen so much, the quantity of new shares needed to fund even modest programs of work can easily erode if not outstrip the size of the resulting value increment.
These pressures are evident among some of the best positioned explorers in Australia. Impact Minerals, Stavely Resources and Thundelarra are examples of companies producing negative investment returns even as they successfully raise capital to support programs overseen by some of the best credentialed executives in the country.
Their spending has been tightly managed. Each company spent more than $70 on exploration for every $30 spent on administration and corporate overheads over the 12 months to the end of June 2017.
Western Australian copper and gold explorer Thundelarra recently launched a heavily discounted rights issue with attached options to raise as much as A$4.2 million. The discount precipitated a 39% drop in the share price to mirror the offer.
The cost to the existing shareholder base of the company topping up its exploration kitty - A$6.8 million - exceeded by more than 50% the amount being raised. A 40% increase in the number of shares to be issued equated with only a 7% increase in shareholder capital.
Impact Minerals shareholders gave up A$7.9 million in value ahead of a A$4.0 million cash top-up in May 2017. Stavely Resources exchanged A$5.7 million for A$3.5 million in November 2016.
St George Mining, another leading explorer, is taking an innovative approach to shoring up flagging investor interest. It is about to grant investors a bonus issue of listed options as long as they are on the share register before 20 September. With three years to expiry, the value of the benefit could be as much as $1.2 million.
The St George move has bought some relief from a four month share price slump of 55% and may give it future capital raising opportunities. The market value of the company has risen $7.5 million since the issue was announced.
The next few weeks will show whether St George has uncovered an innovative way to challenge investor expectations or whether it has simply opened up another zero sum trading opportunity.
For the time being, exploration companies face an unenviable but ultimately compelling choice between ongoing dilution and eventual cessation of exploration.
At some point, a shrinking supply of development-ready projects will force a revaluation of exploration efforts. Investors, with the benefit of hindsight, will then rue missed chances. Until then, the downward price pressures will remain one of the sector’s more frustrating characteristics.