The Current View
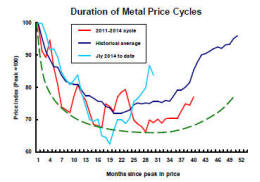
Growth in demand for raw materials peaked in late 2010. Since then, supply growth has generally outstripped demand leading to inventory rebuilding or spare production capacity. With the risk of shortages greatly reduced, prices lost their risk premia and have been tending toward marginal production costs to rebalance markets.
The missing ingredient for a move to the next phase of the cycle is an acceleration in global output growth which boosts raw material demand by enough to stabilise metal inventories or utilise excess capacity.
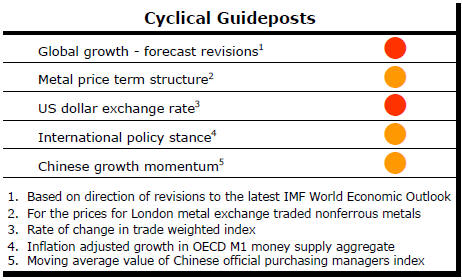
The PortfolioDirect cyclical
guideposts suggest that the best possible macroeconomic circumstances for
the resources sector will involve a sequence of upward revisions to
global growth forecasts, the term structure of metal prices once again
reflecting rising near term shortages, a weakening US dollar, strong money
supply growth rates and positive Chinese growth momentum. None of the five guideposts is "set to green"
(after the most recent adjustments in December 2016) suggesting the sector remains confined
to near the bottom of the cycle.
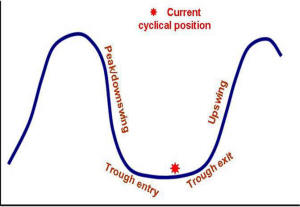
Has Anything Changed? - Updated View
From mid 2014, the metal market cyclical position was characterised as ‘Trough Entry’ with all but one of the PortfolioDirect cyclical guideposts - the international policy stance - flashing ‘red’ to indicate the absence of support.
Through February 2016, the first signs of cyclical improvement in nearly two years started to emerge. The metal price term structure reflected some moderate tightening in market conditions and the guidepost indicator was upgraded to ‘amber’ pending confirmation of further movement in this direction.
As of early December 2016, the Chinese growth momentum indicator was also upgraded to amber reflecting some slight improvement in the reading from the manufacturing sector purchasing managers index. Offsetting this benefit, to some extent, the policy stance indicator has been downgraded from red to amber. While monetary conditions remain broadly supportive, the momentum of growth in money supply is slackening while further constraints on fiscal, regulatory and trade regimes become evident.
Seasonality Dictates Investment Returns
Investors in Australian mining companies should be extra
vigilant around Christmas but could ignore the market for the rest of the
year for better than average investment returns.
After falling 3.8% between the beginning of December and Christmas, the ASX small resources share price index has risen by more than 11%, just on twice the gain over the entire second half of 2016.
A post-Christmas price surge within this segment of the market has now occurred for 17 consecutive years.
A long term average monthly increase in the small resources share price index of 0.6% comes with considerable seasonal variability.
Since 2000, the index has fallen at a 2.5% average pace in November. Seasonal weakness becomes progressively more marked through November and early parts of December.
While average returns for December as a whole have been positive, negative returns leading up to Christmas have been erased by unusually strong gains in the last few days of the year.
In every one of the 17 years since 2000, the market has produced positive returns in the days shortly after the Christmas break.
The average index gain between Christmas and the end of December has been 2.6%. The average gain between Christmas and the tenth day of January has been 4.1%.
The pattern of prices gives every impression of investors tidying up their end of year affairs and, in particular, choosing to hold less of the more risky parts of the market as thoughts turn to cricket and summertime at the beach.
With fewer investors engaged in the market during Australia’s post-Christmas commercial hiatus, liquidity is reduced and even relatively modest quantities of buying can have unusually large positive price impacts.
Once past the typical Australian holiday period, average returns again turn south in the latter part of January.
This pattern of returns should make investors wary about how they react to seemingly strong price action while they have been on holiday.
Price gains over the past fortnight may yet prove a springboard to a stronger 2017 but could, just as easily, be another example of the annual swings and roundabouts typifying sector price action.
The evident seasonality in returns also warrants a rethink by advisers about the timing of their portfolio reviews and resulting decisions to sell into a weakening market.
Much the same goes for June at the close of Australia’s financial year. June returns in 11 of the past 17 years have been negative. Average returns in the following July have usually more than compensated.
Trading around these mid year seasonal movements has been worth an average of six percentage points a year.
Combining the end of financial year trading opportunity with the average four percentage points from the Christmas trade - and remaining out of the market for the rest of the year - offers a high probability of superior investment performance.
The structure of the industry contributes to the strength of the seasonality in the resources share price index. It also throws up other potentially lucrative trading opportunities.
The principal ASX benchmark indices on which attention is most frequently focused are dominated by the influence of BHP Billiton and Rio Tinto. The eight miners within the S&P/ASX 100 are the most likely to be used by institutions making asset allocation changes. Australian domestic influences on the market are, in these cases, diluted by the extensive involvement of international investors.
The so-called small resources share price index is not skewed by the sector’s two global leaders but comprises only 26 of the largest mining companies (along with another seven oil and gas stocks and four service providers) from among the remaining hundreds outside the top eight listed on the ASX.
The stocks within the small resources index are among those most likely to be traded by higher net worth and individual investors with occasional institutional involvement. They are also highly leveraged to changed macroeconomic expectations.
That leaves a third strata of companies, predominantly at the exploration stage, and making up the vast majority of listed companies in the sector. Almost universally regarded as among the most risky, this segment of the market is largely the preserve of risk friendly private investors.
Strengthening returns from this third group of companies, currently trading 87% below prices from six years ago, would be the surest sign of a cyclical realignment.
Double digit relative performance swings are common across these three market segments.
In 2016, the S&P/ASX 100 resources index, which includes three oil and gas producers and three integrated materials companies as well as the eight leading miners, added 37.9%. A 23.5% gain in the second half as institutional investors jumped aboard the Trump-election bandwagon came after relatively modest gains of 11.7% in the first half.
The small resources index climbed 57.8% during the year (with a 49.2% and 5.7% split between the first and second halves, respectively). This was the part of the market which was most highly leveraged to the macro forces which led investors worldwide to embrace more risk during the first half of 2016.
An index compiled by PortfolioDirect to measure the price performance of a basket of 50 exploration companies rose the least in 2016. Its 22% gain was made up of half year contributions of 12.4% and 8.5%.
The 12 month performance differential between the small resources index and the S&P/ ASX 100 resources index widened in favour of the smaller stocks to 60 percentage points during 2016.
Both indices outperformed the exploration end of the market during 2016. Performance differences of up to 35 percentage points have now tilted risk adjusted opportunities in favour of those companies whose primary activity is mineral exploration.
Even in the absence of a generalised cyclical recovery and without having to pore in detail over individual company execution plans, investment opportunities within the sector are presenting themselves.