The Current View
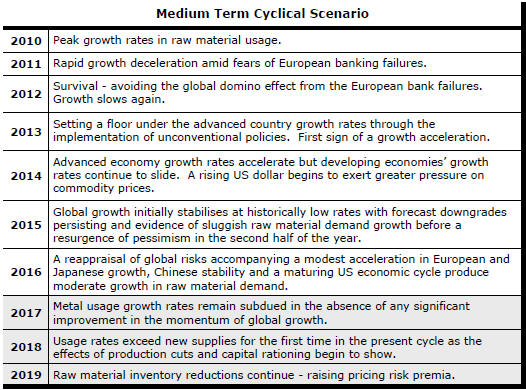
Growth in demand for raw materials peaked in late 2010. Since then, supply growth has generally outstripped demand leading to inventory rebuilding or spare production capacity. With the risk of shortages greatly reduced, prices lost their risk premia and have been tending toward marginal production costs to rebalance markets.
The missing ingredient for a move to the next phase of the cycle is an acceleration in global output growth which boosts raw material demand by enough to stabilise metal inventories or utilise excess capacity.
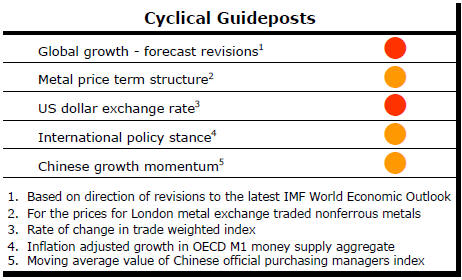
The PortfolioDirect cyclical
guideposts suggest that the best possible macroeconomic circumstances for
the resources sector will involve a sequence of upward revisions to
global growth forecasts, the term structure of metal prices once again
reflecting rising near term shortages, a weakening US dollar, strong money
supply growth rates and positive Chinese growth momentum. None of the five guideposts is "set to green"
(after the most recent adjustments in December 2016) suggesting the sector remains confined
to near the bottom of the cycle.
Has Anything Changed? - Updated View
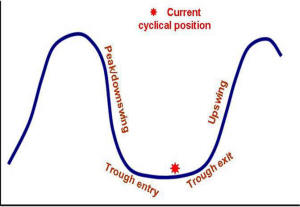
From mid 2014, the metal market cyclical position was characterised as ‘Trough Entry’ with all but one of the PortfolioDirect cyclical guideposts - the international policy stance - flashing ‘red’ to indicate the absence of support.
Through February 2016, the first signs of cyclical improvement in nearly two years started to emerge. The metal price term structure reflected some moderate tightening in market conditions and the guidepost indicator was upgraded to ‘amber’ pending confirmation of further movement in this direction.
As of early December 2016, the Chinese growth momentum indicator was also upgraded to amber reflecting some slight improvement in the reading from the manufacturing sector purchasing managers index. Offsetting this benefit, to some extent, the policy stance indicator has been downgraded from green to amber. While monetary conditions remain broadly supportive, the momentum of growth in money supply is slackening while further constraints on fiscal, regulatory and trade regimes become evident.
US Productivity Constraints on Growth
The fortunes of the mining industry are becoming increasingly
reliant on an acceleration in US output growth - in the absence of that
possibility outside the USA.
Growth in US wages and salaries - which account for 54% of US GDP - has been running at one percentage point below historical rates of growth.
Stronger productivity growth, which would facilitate a strengthening in wages growth, has hit a wall. Output per hour worked has grown at an annual rate of 0.6% since the end of 2012.
The occupational composition of the US labour force is
influencing the productivity outcome.

Since the end of WWII, the services economy has been growing consistently faster then the goods-producing part.
During the war, the number of employees in goods producing jobs was approximately the same as the number engaged in provision of services. Today, there are five services jobs for every private sector job making something.
Over the past five years, the growth in numbers of service jobs has been similar to the growth in goods producing jobs. The long term trend and flattening of the blue line in the chart Illustrates the historical realignment of the economy between services and goods.
The trend in productivity growth, which was strongest immediately after WWII, has been associated with the declining importance of goods producing jobs.
Productivity growth did show a marked improvement during the 1990s which many analysts attributed to the application of new digital technologies to older production processes and business services.
The intensity of the effect of new technology on business seems to have run its course leaving the US economy in an awkward predicament.
Improved US growth outcomes now rely on better productivity outcomes which are typically harder to extract from a predominantly services economy.
Proposals by the new Trump administration to boost infrastructure spending have the potential to provide a productivity fillip.
To get the most out of this potentially more productive economy, the US would need to take advantage of global trading opportunities.
To the extent that productivity improves, benefits are most readily transmitted through the manufacturing sector.
Having access to a bigger market is critical to maximising the opportunity. Imposing constraints on trade, as threatened by the new US administration, potentially undercuts the ability of the economy to gain from any improved productivity performance.
Ideally, productivity-enhancing infrastructure modernisation and expanded trade would go hand in hand. That would work to the advantage of global growth and, consequently, the mining and resources industry.
The US administration contains enough business people at its centre to understand the benefits of stronger trade flows. If their policies are to play out as they would like, improved infrastructure and a more aggressive approach to encouraging US trade will occur.
The problem is not the policy as much as the time it will take for those potentially benefiting from these changes to feel the effect. Years rather than months may be needed before the benefits of the policy are evident.
China to Give Growth Guidance
A series of official meetings have begun in China which will set the tone
for policy making.
On Friday, the Chinese People's Political Consultative Conference met. The CPPCC and China's National People's Congress will ratify the policies and decisions of the Communist Party leadership.
Of most interest will be the report by the Chinese premier on the state of the country.
Comments by the premier about the trajectory of growth will be listened for carefully.
It should go without saying that the days of growth rates approaching 10% are gone forever. A sustainable growth rate for the Chinese economy is more like 5%.
Above normal growth of 6-7% is being achieved by delaying the restructuring toward a more services oriented domestic economy initiated by the communist leaders themselves.
The switch from a capital investment driven economy to one with a stronger services and consumption component has been agreed policy but, at the same time, worries have persisted about the real and cosmetic effects of a significant growth slowdown.
In practice, Chinese officials have been attempting a re-adjustment in growth expectations by easing back relatively high rates of lending growth to finance capital intensive activities only gradually.
Most likely, the Chinese leadership will use the current round of high profile meetings to continue to adjust expectations with a further lowering of its growth targets.
China's approach has implications for the cyclical positioning of the resources industry. As long as China is engineering a move toward a permanently lower growth path, the chance of an acceleration in global growth rates is lowered.
Without an acceleration in global growth, the usual surge in raw material usage rates which underpins the commencement of a fresh cycle becomes harder to achieve.