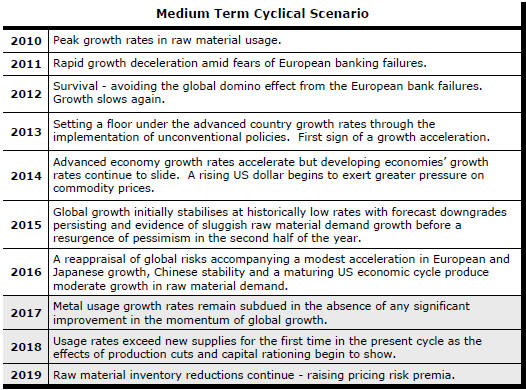
The Current View
Growth in demand for raw materials peaked in late 2010. Since then, supply growth has generally outstripped demand leading to inventory rebuilding or spare production capacity. With the risk of shortages greatly reduced, prices lost their risk premia and have been tending toward marginal production costs to rebalance markets.
The missing ingredient for a move to the next phase of the cycle is an acceleration in global output growth which boosts raw material demand by enough to stabilise metal inventories or utilise excess capacity.
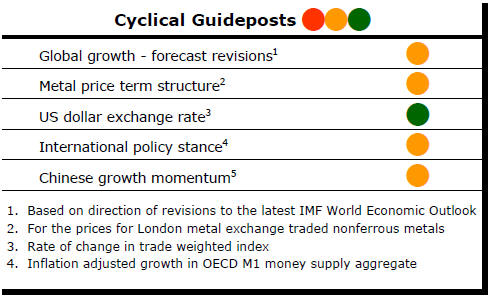
The PortfolioDirect cyclical
guideposts suggest that the best possible macroeconomic circumstances for
the resources sector will involve a sequence of upward revisions to
global growth forecasts, the term structure of metal prices once again
reflecting rising near term shortages, a weakening US dollar, strong money
supply growth rates and positive Chinese growth momentum. Only one of the five guideposts is "set to green"
(after the most recent adjustments in July 2017) suggesting the sector remains confined
to near the bottom of the cycle.
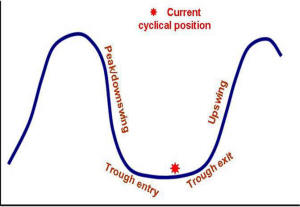
Has Anything Changed? - Updated View
From mid 2014, the metal market cyclical position was characterised as ‘Trough Entry’ with all but one of the PortfolioDirect cyclical guideposts - the international policy stance - flashing ‘red’ to indicate the absence of support.
Through February 2016, the first signs of cyclical improvement in nearly two years started to emerge. The metal price term structure reflected some moderate tightening in market conditions and the guidepost indicator was upgraded to ‘amber’ pending confirmation of further movement in this direction.
As of early December 2016, the Chinese growth momentum indicator was also upgraded to amber reflecting some slight improvement in the reading from the manufacturing sector purchasing managers index. Offsetting this benefit, to some extent, the policy stance indicator was been downgraded from green to amber.
The most recent change in cyclical guidepost positioning has been at the end of July 2017 when the exchange rate guidepost was upgraded to green.
Currency Impacts Dominating Outcomes
Metal prices are approaching or exceeding record levels for the current
cycle.
The improved prices are consistent with the historical timing of such moves (as shown in the 'Duration of Metals Price Cycles' chart on the right) but only one of the PortfolioDirect cyclical guideposts is 'green' suggesting that the underlying market momentum has improved but still lacks the force which comes with improved demand.
The International Lead Zinc Study Group has estimated that global zinc usage over the six months to June 2017 had increased by less than 1% from usage in the corresponding period of 2016.
The International Copper Study Group has reported that
copper use in the five months to May was 3% below usage rates in the
corresponding period of 2016.
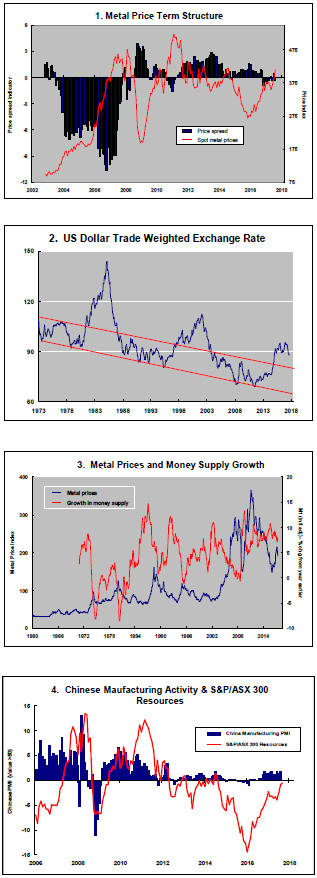
Metal price movements have coincided with a potentially cyclical change in the direction of the U.S. dollar which has now fallen by more than 7% since its peak in January 2016, based on the index of the major U.S. trading partner currencies.
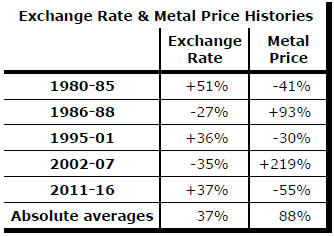
Chart 2 in the panel on the right hand side shows the trajectory of the U.S. dollar over the past 45 years.
The currency has experienced a long-term declining trend occasionally interrupted by significant cyclical upswings.
Five distinct cyclical moves, summarised in the table with the corresponding changes in metal prices, are evident. The metal price measure used is the International Monetary Fund metal price index.
Over the course of the five cycles, average changes of 37% in the exchange rate have been associated with average metal price moves of 88%.
A part of the metal price rise currently underway is the market clawing back losses which can be linked directly to the currency appreciation which occurred during 2011-16 and which cut short an earlier cyclical upswing which had been in response to unusually strong demand for raw materials in 2010 and a continuation of above average rates of demand growth in subsequent years.
Among several large currency moves contributing to the recent US dollar result has been an appreciating Chinese yuan.
 The
Chinese yuan has appreciated by 9% since early May 2017 during which time
the average price gain among the major daily traded base metals has been
16%.
The
Chinese yuan has appreciated by 9% since early May 2017 during which time
the average price gain among the major daily traded base metals has been
16%.
More than half of the rise in metal prices for a Chinese manufacturer would have been canceled out by the Chinese currency move.
There might also have been some buying of metal by Chinese interests to take advantage of the stronger currency in anticipation of further rises in commodity prices leveraged to the U.S. dollar weakness.
It is by no means unusual for higher metal prices to coincide with simultaneous softness i the US dollar but, more often than not, the higher prices have also been underpinned by periods of unusually strong demand (and the associated rise in perceived risk of the industry being unable to meet the additional needs).
For the time being, price rises are unusually reliant on financial market conditions rather than the real economy.