The Current View
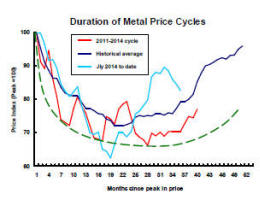
Growth in demand for raw materials peaked in late 2010. Since then, supply growth has generally outstripped demand leading to inventory rebuilding or spare production capacity. With the risk of shortages greatly reduced, prices lost their risk premia and have been tending toward marginal production costs to rebalance markets.
The missing ingredient for a move to the next phase of the cycle is an acceleration in global output growth which boosts raw material demand by enough to stabilise metal inventories or utilise excess capacity.
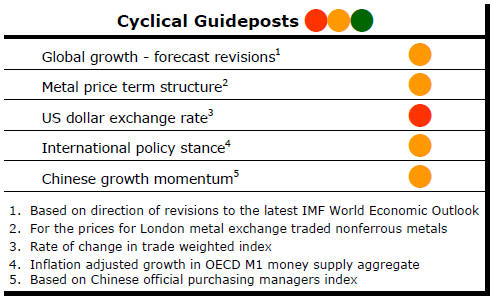
The PortfolioDirect cyclical
guideposts suggest that the best possible macroeconomic circumstances for
the resources sector will involve a sequence of upward revisions to
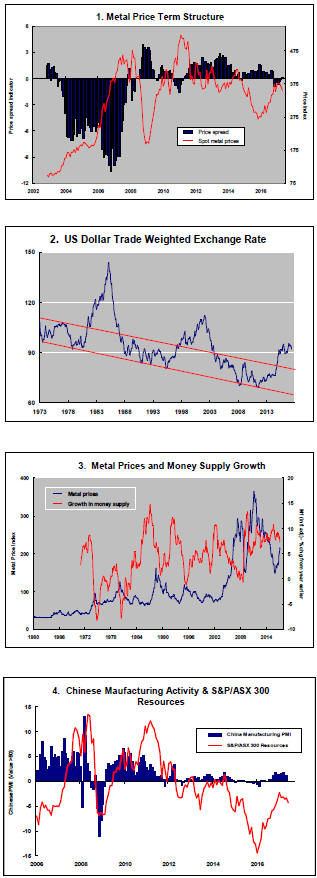
global growth forecasts, the term structure of metal prices once again
reflecting rising near term shortages, a weakening US dollar, strong money
supply growth rates and positive Chinese growth momentum. None of the five guideposts is "set to green"
(after the most recent adjustments in December 2016) suggesting the sector remains confined
to near the bottom of the cycle.
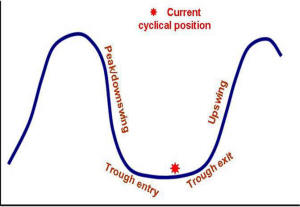
Has Anything Changed? - Updated View
From mid 2014, the metal market cyclical position was characterised as ‘Trough Entry’ with all but one of the PortfolioDirect cyclical guideposts - the international policy stance - flashing ‘red’ to indicate the absence of support.
Through February 2016, the first signs of cyclical improvement in nearly two years started to emerge. The metal price term structure reflected some moderate tightening in market conditions and the guidepost indicator was upgraded to ‘amber’ pending confirmation of further movement in this direction.
As of early December 2016, the Chinese growth momentum indicator was also upgraded to amber reflecting some slight improvement in the reading from the manufacturing sector purchasing managers index. Offsetting this benefit, to some extent, the policy stance indicator has been downgraded from green to amber. While monetary conditions remain broadly supportive, the momentum of growth in money supply is slackening while further constraints on fiscal, regulatory and trade regimes become evident.
Policy Raises Growth Doubts
Major financial disruptive events and their consequential negative impact on
growth have usually been preceded by a sequence of monetary tightening which
has gone further than policymakers, with the benefit of hindsight, would
have liked.
The Federal Reserve confirmed at its June meeting that it intended to keep pushing interest rates higher and, perhaps later this year, begin running down the size of its balance sheet after a decade of securities purchases to prop up financial asset prices.
[] Tightening policies would normally be prompted by some combination of growth running above its sustainable potential and inflation expectations moving higher.
Neither of these two conditions are currently evident in the USA.
Fed policymakers are anticipating somewhat stronger growth and higher inflation but the evidence for this is not clear-cut.
U.S. growth has appeared to hit a ceiling at 2%.
Although inflation has risen, it remains below the Fed target. Meanwhile, some Fed governors have begun to lead a public discussion about the possibility of structural impediments to the continued rise in inflation particularly as technology helps to improve retail productivity.
The recent announcement that Amazon intends to buy a
U.S. food retail chain has given that thought greater credibility.

Against this background, short term interest rates have begun to rise even while longer term rates have been declining.
The chart shows the spread between the U.S. two year and 10 year bond yields. An upward move in the blue line signifies a narrowing of the spread as short term yields rise more quickly.
Recession has coincided with those occasions on which the two year yield has exceeded the yield on 10 year securities.
Based on the historical experiences of this measure, the U.S. economy is heading toward a slowdown in activity.
The Fed is acting in anticipation of changing conditions about which the bond market is expressing considerable scepticism.
Only one of the Fed or the bond market will be right.
For the resources sector, the risks in these scenarios are tilted toward the downside.
If the indications from the bond market are correct, growth momentum will decline leading to a worsening of global market raw material balances.
If the current view of the Federal Reserve comes to pass, at best growth will have stabilised around current levels, eliminating the “surprise” which is normally required to hasten the onset of a commodity price cycle.