The Current View
Growth in demand for raw materials peaked in late 2010. Since then, supply growth has generally outstripped demand leading to inventory rebuilding or spare production capacity. With the risk of shortages greatly reduced, prices lost their risk premia and have been tending toward marginal production costs to rebalance markets.
The missing ingredient for a move to the next phase of the cycle is an acceleration in global output growth which boosts raw material demand by enough to stabilise metal inventories or utilise excess capacity.
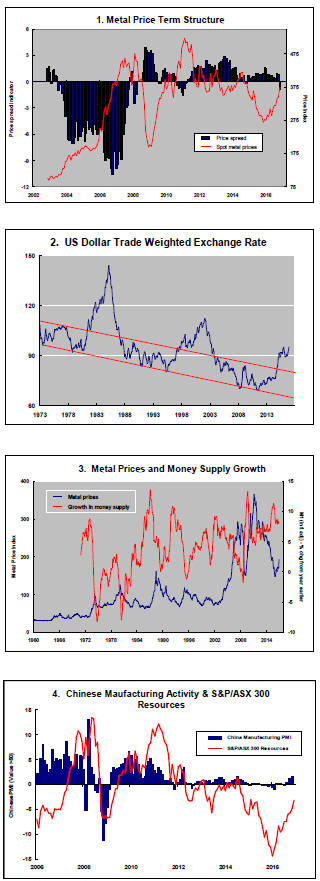
The PortfolioDirect cyclical
guideposts suggest that the best possible macroeconomic circumstances for
the resources sector will involve a sequence of upward revisions to
global growth forecasts, the term structure of metal prices once again
reflecting rising near term shortages, a weakening US dollar, strong money
supply growth rates and positive Chinese growth momentum. None of the five guideposts is "set to green"
(after the most recent adjustments in December 2016) suggesting the sector remains confined
to near the bottom of the cycle.

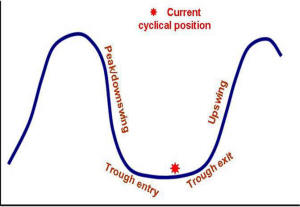
Has Anything Changed? - Updated View
From mid 2014, the metal market cyclical position was characterised as ‘Trough Entry’ with all but one of the PortfolioDirect cyclical guideposts - the international policy stance - flashing ‘red’ to indicate the absence of support.
Through February 2016, the first signs of cyclical improvement in nearly two years started to emerge. The metal price term structure reflected some moderate tightening in market conditions and the guidepost indicator was upgraded to ‘amber’ pending confirmation of further movement in this direction.
As of early December 2016, the Chinese growth momentum indicator was also upgraded to amber reflecting some slight improvement in the reading from the manufacturing sector purchasing managers index. Offsetting this benefit, to some extent, the policy stance indicator has been downgraded from red to amber. While monetary conditions remain broadly supportive, the momentum of growth in money supply is slackening while further constraints on fiscal, regulatory and trade regimes become evident.
Picking the Right Commodity
Setting mine development priorities based on expectations of future
commodity prices is little more than wishful thinking feebly disguised as
strategy.
‘What’s your preferred commodity?’ is a frequently asked question around mining investment conferences.
As recent moves in crude oil, iron ore and thermal coal prices affirm, there is money to be made from trading around short term movements in commodity prices either directly or through relevantly exposed equities.
Whether today’s view of prices should guide development decisions with five or 10 year gestation periods is an entirely different matter.
Among the nonferrous metals, long term performance differences are minor.
Since the beginning of 1980, US dollar denominated copper prices have risen at an annualised rate of 2.5% (with a 31% standard deviation). Over the same period, zinc prices have increased at a 3.4% clip and nickel prices have risen at 1.3%, with standard deviations of 36% and 54%, respectively.
The brokers, journalists, investors and executives opining on where long term capital is best deployed are assuming, sometimes unthinkingly, that price disparities on which to hang projects are always available. More tellingly, they are assuming that forecasters can accurately predict their occurrence.
So, what is the chance that the price of copper or zinc or nickel will outpace the rate of price increase of either of the other two metals by a meaningful amount, say 30%, over the coming 12 months?
The distribution of returns over the past 35 years implies a 44% chance of this happening. The chance of a 40% difference would fall to 27%. The chance of a smaller 20% difference would be 66%.
In real life, of course, future differences in price outcomes are unknown. Forecasting one price to beat another comes with a high risk of failure. Research suggests that the chance of professional forecasters correctly predicting future outcomes for a single price is no greater than 30%. Getting multiple prices right simultaneously when they are uncorrelated will be considerably less.
Looking forward from today, the chance of accurately forecasting price outcomes 12 months ahead and, coincidentally, there being a 30% difference upon which to base an investment is going to be less than 15%.
The low probability of this approach proving a worthwhile guide to development decisions comes before any thought about which stock to buy and the additional risks which attach to that decision.
Price performance within timeframes of up to 12 months may dictate investment market interest in what companies are doing but those engaged in mine development need to make judgements about conditions over a lengthier development horizon.
The historical distribution of returns indicates that, for the three base metals, the chance of a 30% price performance differential over five years – a more realistic development horizon – is 60%.
While the chance of a meaningful performance difference increases somewhat over the medium term, accurately forecasting prices is tougher over longer time horizons. Taking account of forecasting risk, the overall chance of making a correct call about a meaningful performance disparity may have fallen to negligible quantities.
In presentations and discussions at the annual Mines and Money conference in London during the past week, lithium and zinc were highly favoured as commodities with the greatest chance of offering above average rates of return.
Of course, in common with mining industry conferences everywhere, only those with the most flattering view of gold are invited to speak. So, gold also received glowing reviews.
Uranium was seen widely by those at the conference as among the least desirable commodity exposures presently. So, too, was thermal coal despite its recently unexpected strength.
These opinions about future performance are heavily anchored in recent price outcomes. Consequently, the commodities viewed most favourably are those whose prices have already risen. The least preferred are those which have already proven most disappointing.
Those companies with sub-standard assets or insufficient skills to confidently bring something into production may have the necessary latitude or excuse to chase the latest commodity price fad. Others should stay focussed on their existing choices.
Companies with otherwise plausible business plans create doubts about their priorities if they are prone to dart off at strategic tangents based on extrapolations of recent commodity price trends. This has never been more evident than in the frenzied reaction to lithium market forecasts in the past year.
In recent months, among Australian companies, Kidman Resources had already eschewed base metals before de-emphasising gold in favour of lithium. Silver City Minerals, founded as a silver-zinc explorer around Broken Hill, also went looking for lithium. Metalicity succumbed to the lithium bug despite having, in its words, one of the world’s largest zinc deposits at a time of significant supply shortage.
The share prices of all three have halved from their peak values in the past year as the initial excitement associated with their lithium dalliances faded. The investment propositions of all three are now badly blurred by their strategic indecision.
Commodity hopping by companies reacting to changing price expectations has brought strategic confusion and little discernible benefit.
Meanwhile, the share price of aspiring zinc miner Ironbark Zinc, up by as much as 130%, has been boosted by the approximately 75% increase in zinc prices during 2016 as it pursues its long anticipated objective of a mine in Greenland.
In commodity markets, the least sustainable prices are typically those running well ahead of industry production costs. Identifying those occurrences before they happen will be financially rewarding but investing after the event is more likely to bring financial disaster. The investment landscape remains littered with late entrant iron ore miners and crude oil producers.
From this perspective, starting a multi-year commitment to lithium production is among the more dangerous investment decisions, presently, and likely to leave dozens of companies lamenting their fickleness. Uranium, despite suffering investor ostracism currently, might be safer.
.